The global gold market is entering a pivotal phase in 2024–25, driven by increasing geopolitical uncertainty, investment demand, and shifting trade patterns among leading exporting nations. As gold prices remain elevated and central banks continue to diversify reserves, exporters across regions—from Switzerland and the United Arab Emirates to South Africa and Australia—are reshaping global supply flows.
Understanding where gold exports are expanding, which markets are driving demand, and how economic and policy trends are influencing trade is essential for traders, investors, and industry analysts. Export Genius provides a data-driven view of top gold-exporting countries, export value trends, and the key demand drivers shaping the global gold trade through 2025.
Global Gold Exports Yearly Trends – Historical Gold Trade Data
Global gold exports have evolved significantly over the past decade, reflecting shifts in mining output, refinery capacity, investment demand, and geopolitical conditions. Tracking the yearly trends in gold exports offers valuable insights into how major producing and refining nations influence global supply, how trade routes shift in response to market pressures, and how pricing cycles shape export values.
Historical gold export data also highlights long-term patterns—from the dominance of Switzerland as a global refining hub to the steady rise of the UAE, Australia, and other emerging players in the bullion trade. This report explores year-by-year gold trade data, identifies the countries driving global shipments, and reveals how changes in production, consumption, and international trade policies have shaped the gold market over time.
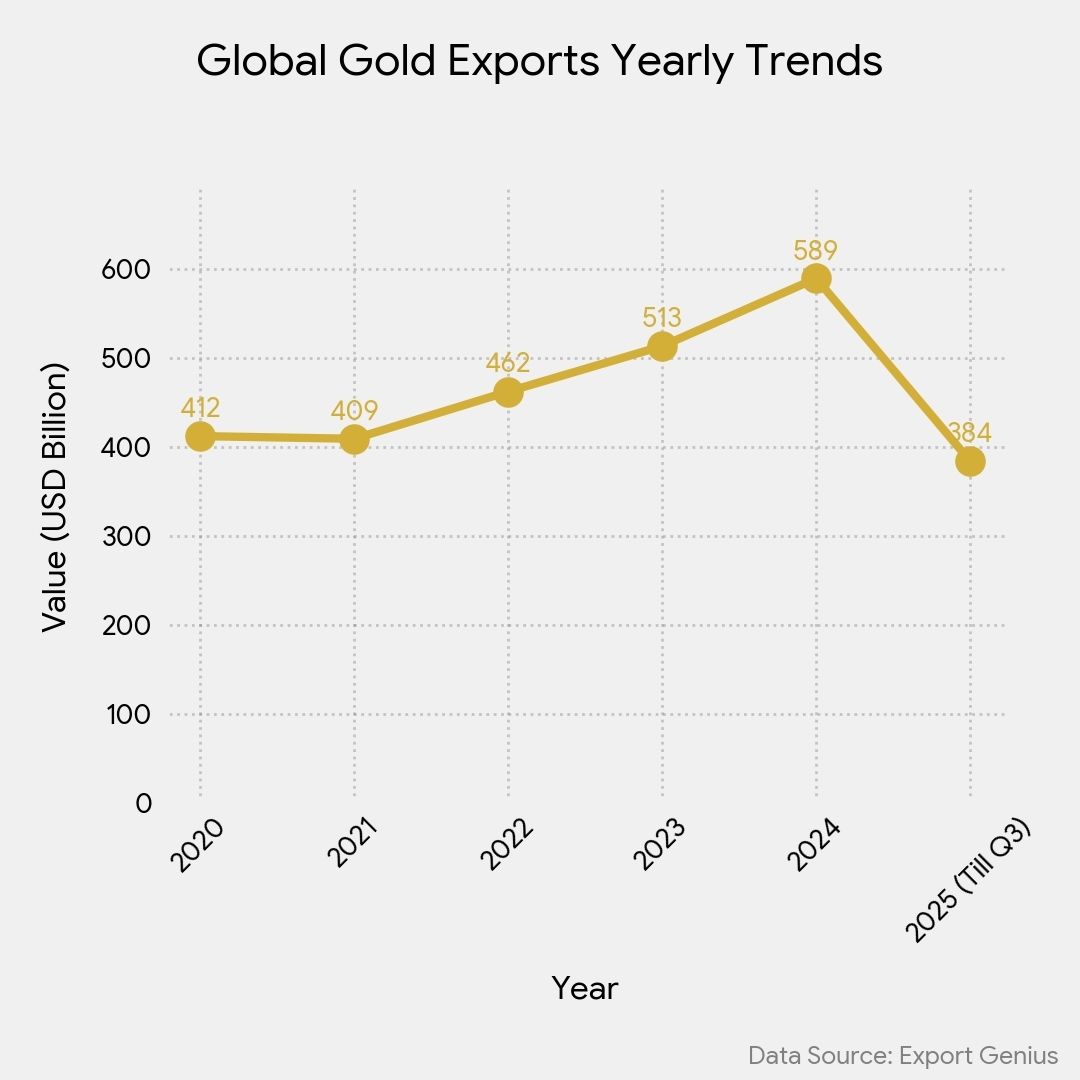
Global Gold Exports Yearly Trends
| Year | Gold Exports (Value USD Billion) |
| 2020 | 412 |
| 2021 | 409 |
| 2022 | 462 |
| 2023 | 513 |
| 2024 | 589 |
| 2025 (Till Q3) | 384 |
Top Gold Exporting Countries
Trade flows remain dominated by financial-arbitrage hubs (Switzerland, UK, Hong Kong, UAE) rather than mine-production leaders. Expect export values to stay large where refining/financial services are concentrated even if mine output is elsewhere. Top gold exporting countries 2024 are:
- Switzerland – largest exporter (major refining and vaulting hub).
- United Kingdom – bullion trading/clearing centre.
- Hong Kong – regional trade and vaulting gateway for Asia.
- United Arab Emirates – re-exports and bullion trade hub.
- United States, Canada, Australia, Singapore, Japan and Russia – exporters either for mined gold, refined product or re-exports.
Top Gold Exporting Countries
| Country | 2024 (Value USD Billion) | 2025 Till Q3 (Value USD Billion) |
| Switzerland | 116 | 139 |
| United Kingdom | 65 | 68 |
| Hong Kong | 56 | 54 |
| United Arab Emirates | 55 | 53 |
| United States | 29 | 31 |
| Canada | 27 | 29 |
| Australia | 23 | 26 |
| Japan | 17 | 17 |
| Singapore | 17 | 11 |
| Germany | 15 | 10 |

Global Gold Export Trends
Global gold export trends continue to evolve as shifts in production, refining capacity, investment demand, and geopolitical dynamics reshape the flow of bullion across international markets. Over the past several years, major exporting countries—from traditional mining leaders to emerging refining hubs—have adapted their strategies in response to fluctuating gold prices, tighter regulations, and rising demand from both investors and central banks.
Understanding these export trends is essential for traders, analysts, and businesses seeking to navigate the complex global gold supply chain. This overview highlights how export values, major trade routes, and key contributing countries are changing, offering a clearer picture of where the gold market is headed and what factors are driving global trade momentum.
Record value from record prices
Gold’s price environment in 2024 produced unprecedented trade value even when volumes moved modestly.
Central-bank accumulation
Central-bank buying both tightens available supply and shifts where refined metal is stored/traded.
Jewellery vs recycling
High prices depressed jewellery fabrication in many markets (notably India and China) and raised recycling as households monetized holdings — shifting the composition of physical flows (more investment/recycling, less new fabrication). This affects exporters differently: jewellery exporters face margin pressure.
Infrastructure & re-exports
Countries with large refineries, vault networks and strong compliance/clearing systems (Switzerland, UK, UAE, Singapore, Hong Kong) record high export values because physical bullion often passes through them on its way to end users. Export statistics therefore reflect services and logistics, not just mines.
Key Investment Demand Drivers
Investment demand for gold continues to shape global market trends, influenced by a mix of economic conditions, financial market behavior, and investor sentiment. Understanding the key factors that drive investors toward gold is essential for analysts, traders, and businesses operating across the precious metals ecosystem. From interest rate movements and inflation pressures to geopolitical uncertainty and currency fluctuations, each driver plays a crucial role in determining gold’s appeal as a safe-haven asset.
This section explores the core investment demand drivers that influence gold buying patterns worldwide, revealing how macroeconomic forces, market risks, and institutional strategies collectively shape long-term demand trends.
Central-bank accumulation — sovereign demand (reserves diversification) is structural and less price-sensitive than retail jewellery demand.
Jewellery demand & real incomes — Jewellery dominates consumption in India and China; high prices can depress volumes and increase recycling.
Refining & trade infrastructure — countries with refineries, vaults and clearing systems (Switzerland, UK, UAE) will continue to record high export values as raw bullion enters and refined bars are re-exported.
Market Outlook 2025
Central-bank demand likely to remain a tailwind in 2025; continued purchases will support prices unless countered by a rapid global rate rise.
Investment flows will be price- and sentiment-sensitive: further market stress or rate cuts would favour more inflows; conversely, a surprise policy tightening could trigger profit-taking and push volumes into recycling.
Export winners: hubs with strong refining, compliance frameworks and vaulting (top gold exporting countries 2024 are Switzerland, UK, UAE, Singapore, Hong Kong) are positioned to capture a large share of trade value even as mine geography stays diverse.
The Last Words
The global gold export landscape in 2024–25 is being reshaped by rising bullion prices, evolving investment preferences, and stronger demand from emerging markets. As leading exporters adjust their supply strategies and import-driven economies increase their appetite for refined and investment-grade gold, the trade outlook remains dynamic and highly opportunity-driven. Businesses that stay informed about shifting export volumes, pricing trends, and market hotspots will be best positioned to capitalize on changing global flows.
To make accurate, data-backed decisions in this fast-moving sector, reliable trade intelligence is essential.
Export Genius provides comprehensive gold trade data, market insights, shipment-level records, and analytical tools that help you track real-time trends, evaluate competitors, and identify high-potential markets worldwide.
Stay ahead of the global gold market—explore Export Genius today and turn data into opportunity.